

Hey guys! How are you doing?
In the last post here we learnt about the Digital Differential Analyzer Algorithm. It helps us to plot lines in a very easy way. However it is not the very best of the available approaches we have when it comes to plotting a line.
For example, we have another technique called the Bresenham's Line Algorithm which we are going to study today, which is a much better approach than the Digital Differential Analyzer Algorithm we studied earlier, here.
We can see the advantages of Bresenham's Line Algorithm over Digital Differential Analyzer Algorithm over here:
 |
| Advantages of Bresenham's Line Algorithm over Digital Differential Analyzer Algorithm |
Hence as we can see, its really important we know how Bresenham's Line Algorithm works. So lets get started!
To start with, as we did in DDA, the very first step of Bresenham's Line Algorithm also asks from us the starting and the ending points of the line we are going to plot.
Again, just as the last time, this algorithm also has two different approaches depending upon what the slope of the line is. Let us do it for slope < 1 first.
For Slope < 1
Let us assume the leftmost coordinates of the line as xk ykSimilarly, we would assume the following sign conventions as shown in the diagram below
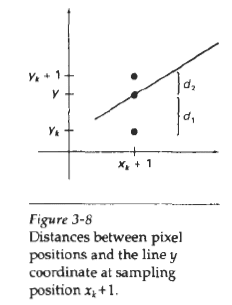
Just as we can see in the image, our line starts from the designated points we assumed above. Our line passes between two pixels
- one at a height of yk
- second at a height of yk+1
The
designated path of our line makes a distance of d1 from the point yk and d2 from the point yk+1
Using the equation of the line

at the starting point of the line, the equation would be

at a subsequent point, as x is incremented, the very same equation becomes
.gif)
Now at this point, just according to the diagram we have above
.gif)
and
.gif)
At this point we have the two distances the designated path of the line makes from the two available pixels that we have. Hence it would only be logical if we choose the pixel that has the lesser distance from the designated path of the line. For the computer to do this easily, we can make a decision parameter. The magnitude of the decision parameter would enable the computer in a very straightforward manner if the upper pixel is to be chosen or not. Remember that when slope is <1, we always make unit increments in x at each step while calculating the increments in y.
Hence to obtain the decision parameter, we subtract the two distances and see if the the value we obtain is positive or negative.
.gif)
Now of course we can write
.gif)
Hence lets finish this
.gif)
Assuming the decision parameter as
.gif)
and a constant
.gif)
we get the final value of our decision parameter
.gif)
Now k is any integral value, which correlates with which step of our calculation we are doing. For the very first and initial calculations, we must assume k to be 0. So
.gif)
for the very first calculation. Also the algorithm asks us to perform the initial calculation with respect of the origin. So the initial coordinates for
.gif)
Hence our new version of our decision parameter now looks like
.gif)
At the origin, the Y intercept is going to be 0 as it is. Hence putting b equal to 0, we get the final value of our original decision parameter,
.gif)
So now we have the decision parameter for our very first calculation. For subsequent calculations, we just now need to find an expression for p(k+1). We do so in following manner, incrementing k to (k+1) and subtracting the decision parameter of the last calculation with the decision parameter of the current calculation. Why are we doing so? You will get to know in a moment.
.gif)
.gif)
.gif)
This completes our step 2. We know have the coordinates and the value of the decision parameters which decides for us whether we are going to increment the value of Y as we increment X or not. But how does it decide that for us? Let us have a look.
If pk (or p0) < 0
We do not increment along the Y Axis. The new coordinate we plot is
.gif)
.gif)
If pk (or p0) > 0
We increment both along the X Axis and along the Y Axis. The new coordinate we plot is
.gif)
and the expression for the next subsequent decision parameter we have is
.gif)
Hence the general algorithm is summed up here:
.PNG)
Let us now have a discussion as to why we did all this. Our computer deals in binaries. 0s and 1s, true and false and that's all. Along the same lines, we make it actually much faster for the computer to perform operations if they are based solely upon addition or subtraction operations and nothing else. Hear the same in a different way. Values that change over every iteration take a longer time to process than operations that give a simple true or false values. Also operations that involve operations like multiplication or division or exponentiation or ANYTHING other than addition or subtraction take a longer time to process. Hence we always try to keep our computations that way.
When we obtained the distance of the line from the nearest pixels, we subtracted the two distances only to obtain an expression that results in a simple binary value. If x-y gives a positive value, we can safely assume y is smaller than x and hence we must deviate towards y for our line to contain the least possible aliasing (jagging). And vice versa.
Similarly we found the values for pk and p(k+1) and subtracted them to obtain an expression that involved simple operations of addition and subtraction, while consequently reducing our operations to those which can be operated upon in a binary fashion; either this or that. If the value of pk (or p0) gave us a value < 0 we did this or else that.
In this way we reduce the stress from our computers a great deal. This results in faster computation times in real world performance.
For Slope >1
Going back, if the slope of the line is > 1, I wanted to say that it doesn't make ANY difference whatsoever in our calculations. If you understood the way we performed the above calculations, I'm confident you can perform these too. That is that because I'm not usually the one who promotes internet as an assignment copying platform, rather I'd be happy if you learnt it and did it yourself. But still, to help you in some way, I'd be providing some crucial equations for you. Any problems whatsoever, feel free to ask in the comments :)
Remember that in this case we increment along Y Axis one unit every iteration and calculate the increment along X Axis at each step.
Using the following diagram for sign convention
Equation of line
Remember that in this case we increment along Y Axis one unit every iteration and calculate the increment along X Axis at each step.
Using the following diagram for sign convention
 |
| Bresenham's Line Algorithm for slope > 1 |
Equation of line
.gif)
Respective distances
.gif)
.gif)
Subtract d2 from d1, replace m as we did above and we get

As before, assuming
.gif)
.gif)
and subtracting pk from p(k+1) we get
.gif)
If Pk > 0
(d1-d2) > 0 which means d2 is small.
So the pixel making a distance of d2 from the designated path of line is selected.
Hence a unit increment is made along both the X and Y Axes.
- x(k+1) = xk + 1
- y(k+1) = yk + 1
.gif)
If Pk < 0
(d1-d2)<0, which means d1 is small.
So the pixel making a distance of d1 from the designated path of line is selected.
Hence a unit increment is made only along the Y Axis. The X Axis coordinate is not incremented.
- x(k+1) = xk
- y(k+1) = yk + 1
.gif)
Going along the same lines, the initial decision parameter's expression is going to be like the one given below.
.gif)
The above expression was obtained as we substituted the values for b, xk and yk =0 in the equation you might have derived for pk.
With this we finish our theory work. By now I expect you to have understood the concept quite clearly. Hence I now present before you the code for performing Bresenham's Line Algorithm in C.
//Shubham Mehta, Write a program to implement Bresenham's Line Algorithm.
#include <stdio.h>
#include <conio.h>
#include <graphics.h>
void main()
{
 int gd, gm;
 float x1, x2, y1, y2, dx, dy, p, xk, yk, slope;
 clrscr();
 printf("%s", "Please enter x1: ");
 scanf("%f", &x1);
 printf("%s", "Please enter y1: ");
 scanf("%f", &y1);
 printf("%s", "Please enter x2: ");
 scanf("%f", &x2);
 printf("%s", "Please enter y2: ");
 scanf("%f", &y2);
 gd=DETECT, gm;
 initgraph(&gd, &gm, "C:\\TC\\BGI");
 putpixel(x1, y1, RED);
 slope=(y2-y1)/(x2-x1);
 dx=x2-x1;
 dy=y2-y1;
 xk=x1;
 yk=y1;
 if(slope < 1)
 {
  p=(2*dy)-dx;
  for( ; x1 < = x2; x1++)
  {
   if(p < 0)
   {
    putpixel(++xk, yk, RED);
    p+=(2*dy);
   }
   else
   {
    putpixel(++xk, ++yk, RED);
    p=p+(2*dy)-(2*dx);
   }
  }
 }
 else
 {
  p=(2*dx)-dy;
  for( ; y1 < = y2; y1++)
  {
   if(p < 0)
   {
    putpixel(xk, ++yk, RED);
    p+=(2*dx);
   }
   else
   {
    putpixel(++xk, ++yk, RED);
    p=p+(2*dx)-(2*dy);
   }
  }
 }
 getch();
 closegraph();
}
With the code and theory both understood and practised, I sign off for today, hoping to see you later in advanced Graphics topics we are going to see next. You may look here for the references for this post. Take care :)
0 comments:
Post a Comment